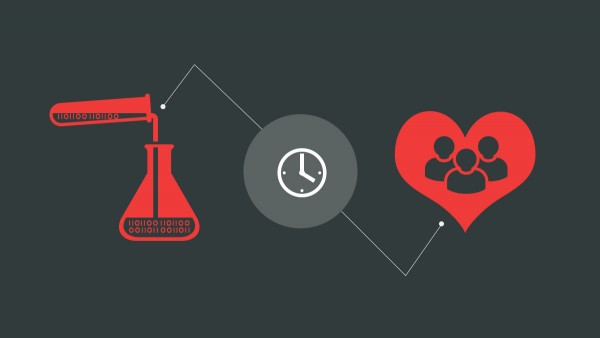
Data Understand your customer with visualized data and data science.
Mine your data for customer insights and then visualize it.
Data Science
Deep dive your data. Chart it and use it to make actionable decisions that aren't based on gut-feel.
Learn moreAnalytics Dashboard
Build an Analytics Dashboard and take charge of your core business metrics.
Learn moreData Visualization
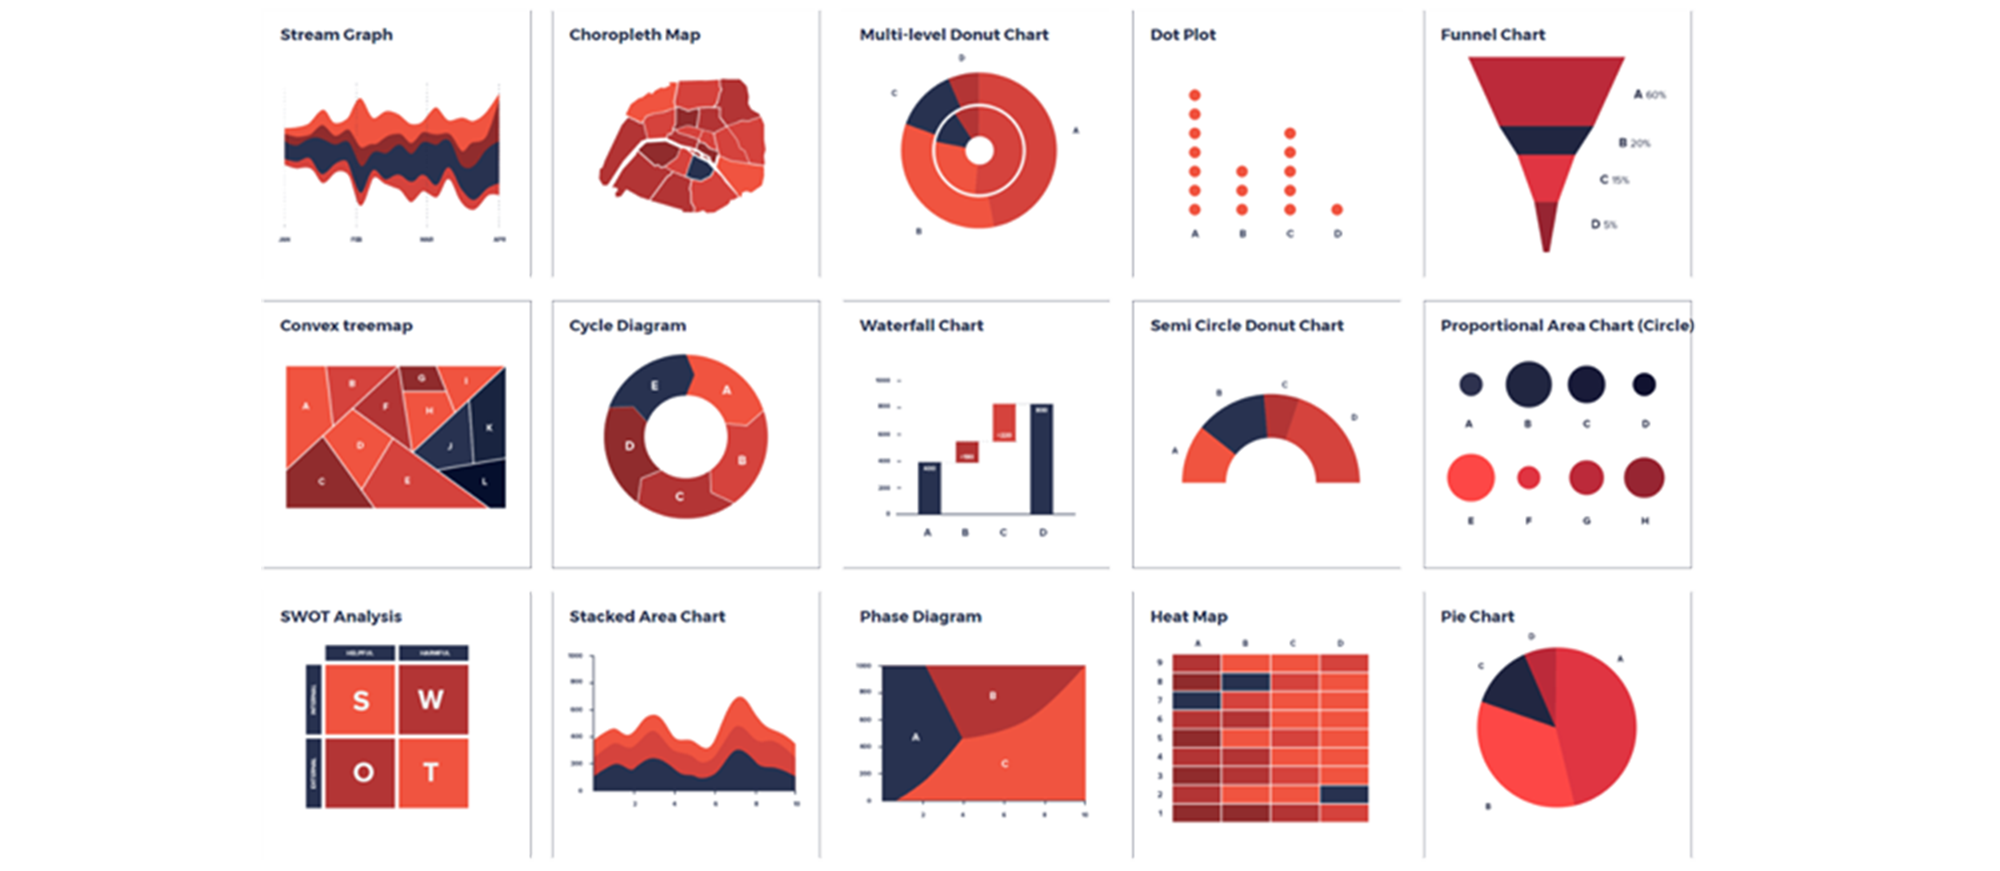
With tools like HTML5, Bootstrap, Excel & Tableau, give your data context by visualizing it.
Learn moreUse Data to Chart Your Course Mine your data for effective insights into customer activity, demographics, behaviour and location.

Data Sciences & Reporting Consulting
$150 / hr or cost per project.
- Highly Professional
- Quality of work is unmatched
- Lower total cost than a FTE
What do I get with Data Services from Seakay Co?
Data Extraction from CRM systems, Lead Management Systems, SQL Database systems, LOB Apps, Access Databases, Custom Apps, Home grown Apps, Excel files. Data manipulation and joining of datasets to create greater customer insights. Charts, Tables & Visualizations of data. Project cost for custom reports and visualizations. Show us your data, tell us how you want it to be analyzed and visualized, we'll make it happen. Project cost or hourly.

Data Doesn't Have Personality
Data can lie, it can be truthful, it can be difficult and at times, wrong. However, what it doesn't have is personality. Humans do. We create and manipulate data. Let Seakay Co. take the guesswork out of your data.
The biggest problem with data is that naturally, data is raw. We have to organize it. We can use computers to organize it, but at some point, a human has to tell the computer how it should go about organizing. The human element in data is what makes it lie, be difficult and wrong.
If you don't have confidence in your collected, centralized and reported on metrics, you can't do business. You don't know what you don't know.
Let Seakay Co. take a deep dive into your data and you can be confident that we'll peel back the layers until we've got a dataset that you can be proud of.

Real-Time Data Enables Smarter Decision Making
Your data, at your finger tips.
Want to know how many chat sessions, web sessions, enrollments, leads, starts you've had this week, month, year? Presented in a beautiful dashboard format that can be accessed from anywhere?
Of course you do, we all do. It just never happens right. It's always half-done or half-working, such that it's not really of much use.
Let's change that. Using any number of platforms, we'll be able to get you your data in concise way that's complete and in the format and medium that you want it in.

Visualize it to Contextualize it
Give your data meaning with Data Visualization.
Because of the way the human brain processes information, using charts or graphs to visualize large amounts of complex data is easier than decyphering spreadsheets or reports. Data visualization is a quick, easy way to convey concepts in a visual manner.
With your data properly visualized, you'll be more able to comprehend your complex data quickly, pinpoint emerging trends, identify relationships and patterns and then be able to communicate the story to others.


